Lack of a Standardized ABM Data Model
You’re getting ready for the upcoming QBR…
You partnered with your RevOps team to pull all of the data around your defined ABM metrics.
But there are two GLARING questions that your presentation fails to answer:
- “How is my program performing vs. my peers?”
- “Do these metrics prove causation vs. a mere correlation?”
 Hang tight… we’re working on it!
Over the past 60-days, we’ve been asked to share benchmark data around “engagement performance” more times than we can count.
🗣️ Our answer: we don’t have this (yet), and neither does anyone else.
🧐 Here’s why:
- The legacy Demand Waterfall (2006 version) that was created by SiriusDecisions is STILL the underlying architecture most VC’s and C-suite executives defer back to.
- A standardized data model that is built for an account-based motion AND has wide-scale adoption doesn’t exist; agencies, ABM platforms and internal teams all build different variations.
If it feels like we lack a common language around measurement and reporting architecture - it’s because we do.
Every organization’s GTM motion is different, so naturally there will be slight variations… but there still needs to be a standardized architecture that holds naming conventions, definitions and stages that allow marketers to speak apples-to-apples.
How to Benchmark Success
So we don’t have a standardized ABM data model… now what?
Use your internal data to generate benchmark data ✅
The main objective of doing so is to demonstrating that your account-based efforts and success are due to causation, and not a mere correlation.
- Causation: refers to a relationship where one event directly results in the occurrence of another event.
- Correlation: describes a scenario where two or more variables or events are associated with each other in some manner but does not necessarily imply that one causes the other.
Here are 2 pathways we recommend leveraging.
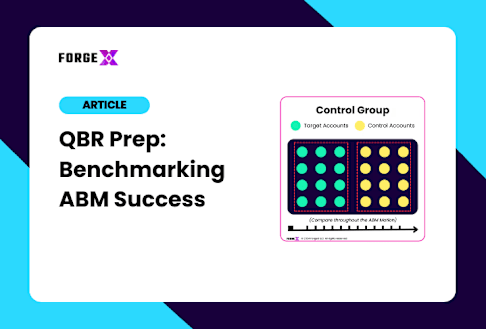
#1 Benchmarking: Against a Control Group
 Internally Benchmarking ABM
Implementation:
- Create two groups:
- A “treatment group” (your target account list) that is exposed to the initiatives within the ABM program.
- A “control group” that is not.
- Both the treatment and control groups should include ‘look-alike’ accounts that share similar attributes in order to foster comparability.
- Track the same metrics for both groups throughout the ABM program, referencing the performance metrics of the control group as a baseline.
When we recommend this:
- This is our top choice 🏆
- This method is particularly valuable in isolating the effects of ABM from other variables, providing a clearer picture of causation rather than mere correlation.
- This approach is ideal for organizations looking for a rigorous analysis of ABM effectiveness and those who can ensure the integrity and comparability of the control and treatment groups over the evaluation period.
#2 Benchmarking: Pre-ABM Impact vs. Post-ABM Performance
 Internally Benchmarking ABM
Implementation:
- Pull all historical data related to your ABM target account list prior to the implementation of the ABM program. Ensure the historical timeframe chosen provides a substantial data set (do not only pull 2-weeks worth of historical data).
- This should be the same data that will be leveraged in the account-based data model you plan on utilizing in your ABM program to measure success.
- Conduct a thorough analysis of how your ABM target account list performed historically to establish a baseline.
When we recommend this:
- You are unable to leverage a control group.
- Your organization has a stable historical dataset and external market conditions have remained relatively constant.